Resource Planning Template: Who Works on What, at What Share (2026)
A resource planning template answers the question a status meeting never quite does: what is each person on this team carrying right now? The sheet below puts ten people down the rows and three projects across the columns, plus a column for support work that never shows up in project plans yet eats 10 to 30 percent of most weeks. Each cell holds a share of one person’s week. The math columns then add every row up and flag the two people who are quietly past 100 percent.
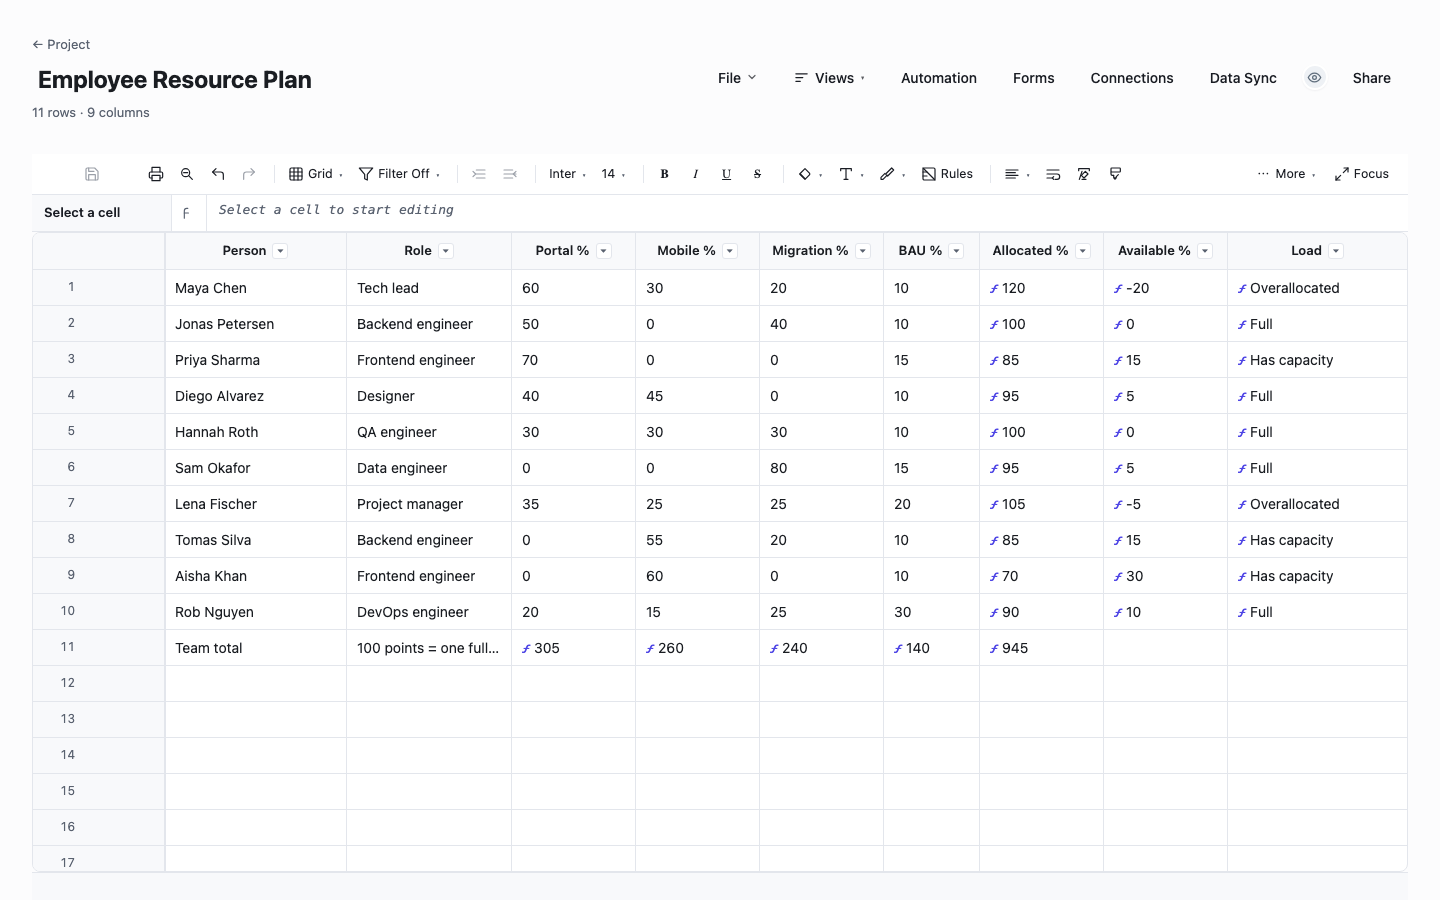
The pre-filled team is deliberately imperfect. Maya sits at 120 percent because three projects each claimed a slice of their tech lead without checking the other two. Aisha has 30 points of open headroom nobody noticed. That is the pattern this sheet exists to surface, and it is why the template ships full of sample data instead of blank rows.
Rebalance a team in the browser. No signup.
A slice of the resource plan you can type into right now. Change a share and watch the Allocated total and the Load flag recompute as you type, the same formulas the full sheet runs. Edits stay in your tab and vanish on close. The signup path turns it into a sheet your whole team can keep current.
=[Portal %]@row + [Mobile %]@row + [Migration %]@row + [BAU %]@rowfills Allocated %| Person | Role | Portal % | Mobile % | Migration % | BAU % | Allocated % | Load |
|---|---|---|---|---|---|---|---|
| 120 | Overallocated | ||||||
| 100 | Full | ||||||
| 85 | Has capacity | ||||||
| 95 | Full | ||||||
| 105 | Overallocated | ||||||
| 85 | Has capacity | ||||||
| 70 | Has capacity |
Sandbox only, edits don't persist. Want to keep your work? Start your 7-day free trial →
Three resource planning templates, free to download
All three are real sheets exported from Wisegrid with the sample team filled in. Excel opens them, as does anything that speaks .xlsx, with no email gate in front of the files. Start with the percent grid if you are new to resource planning.
Employee Resource Plan
The percent-of-week grid, one row per employee. Portal, Mobile, Migration and BAU columns hold each person’s share of the week, then Allocated % adds the row up, Available % shows what is left of 100, and a Load formula labels every row Overallocated, Full or Has capacity. The bottom row sums each project column for the whole team, so you can read that Portal Rebuild is consuming 305 percent, which is three full-time people and change. Two of the ten sample rows arrive overallocated on purpose.
Resource Allocation by Hours
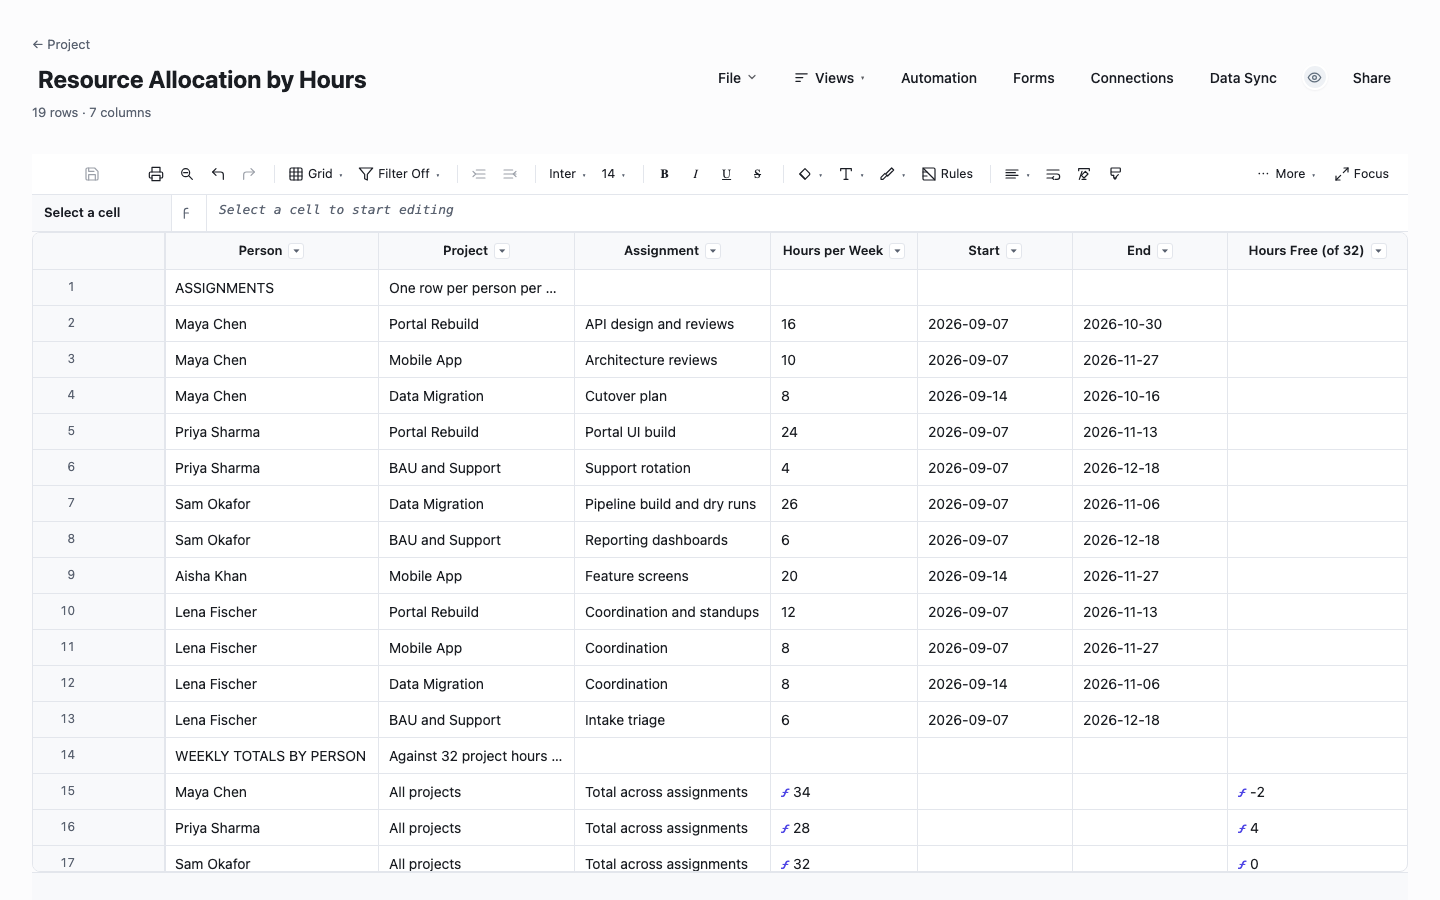
The same planning idea in hours instead of percents, for teams that schedule against a number like 32 project hours per week. One row per assignment: person, project, the work itself, hours per week and a date range. A totals block at the bottom uses SUMIF to roll every person’s assignments into one number and compares it against the 32-hour bar, so Maya’s three assignments surface as 34 hours and 2 hours over. Use this version when percent-of-week feels too abstract for the people filling it in.
Project Staffing Plan
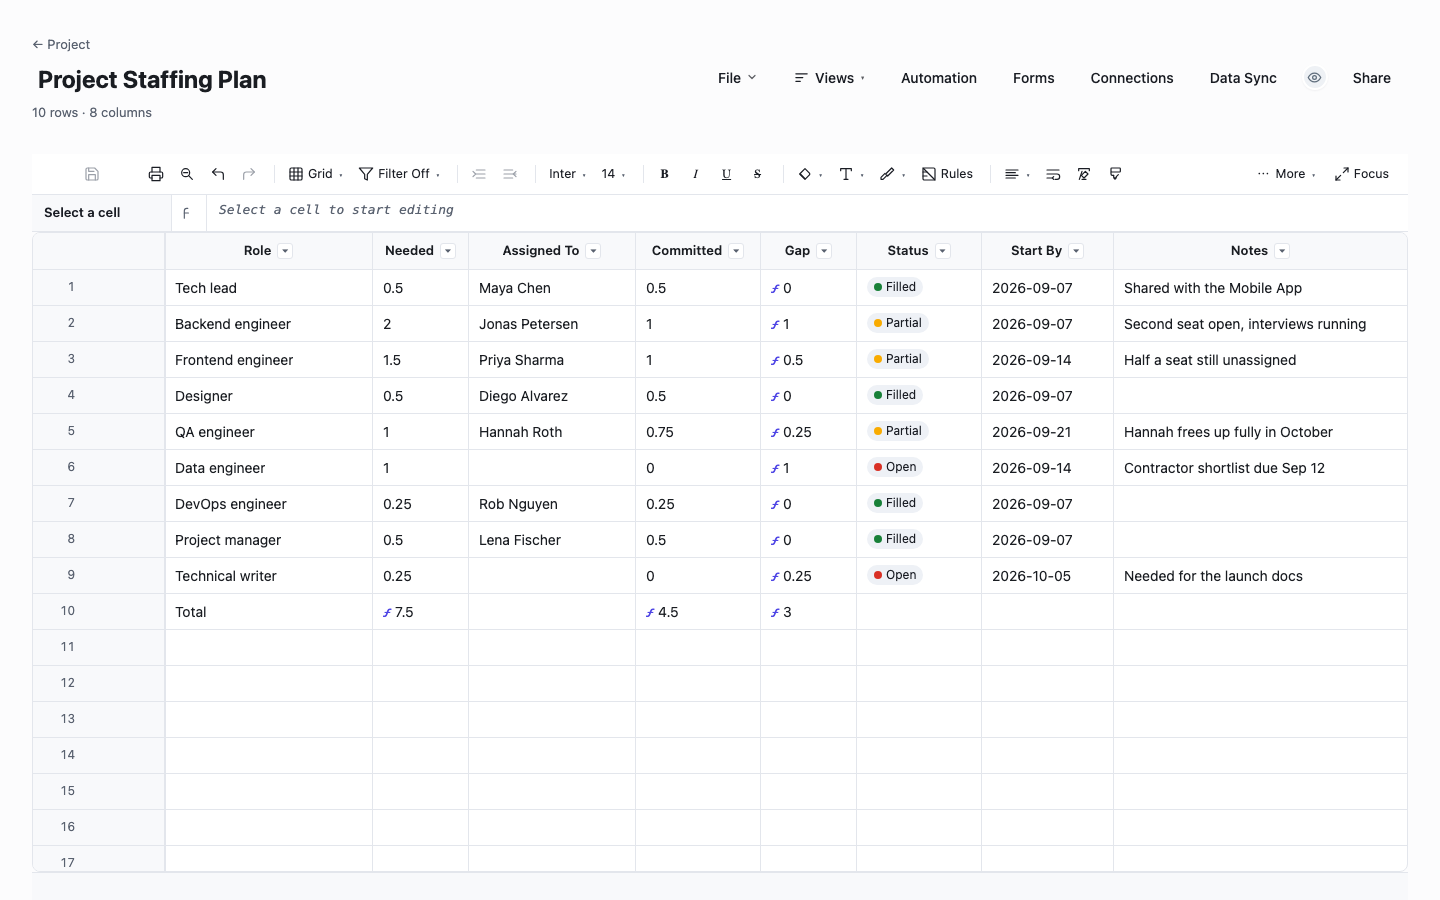
The forward-looking variant: one project, the roles it needs, and how much of each role is committed so far. Needed FTE minus committed FTE computes a Gap column, and a status dropdown tracks Filled, Partial and Open seats. The sample project needs 7.5 FTE, has 4.5 committed and shows exactly where the missing 3 FTE sit, including a data engineer seat with nobody in it. Bring this one to the staffing conversation that happens before a project is approved.
How to build a resource plan that matches reality
List people first, projects second
Start from the roster, not the project list. Every person on the team gets a row whether or not they are on a project this month, because unlisted people are where hidden capacity hides. The sample sheet carries all ten team members, including Aisha, whose row is the one that turns out to matter when the next request lands.
Give support and BAU work its own column
On-call rotations, customer escalations, hiring interviews and the standing meetings that come with seniority are real load. The sample team charges between 10 and 30 percent of each week to the BAU column. Plans that skip this column read as if everyone has a full week for project work, and they are wrong by exactly that margin.
Let formulas do the adding
Allocated % is a formula, =[Portal %]@row + [Mobile %]@row + [Migration %]@row + [BAU %]@row, and Available % is =100 - [Allocated %]@row. Typing totals by hand is how a plan drifts from the truth one edit at a time. In Wisegrid the @row references recalculate the moment any share changes, so the flags update while you type.
Flag overallocation in its own column
The Load column runs =IF([Allocated %]@row > 100, "Overallocated", IF([Allocated %]@row >= 90, "Full", "Has capacity")) so nobody has to scan a grid of numbers to find the problem. A row reading Overallocated is a decision waiting to be made. The sample sheet ships with two, Maya at 120 and Lena at 105, which is a normal Tuesday on most teams.
Rebalance before you escalate
When a row goes past 100, look down the Available % column before asking anyone for more people. In the sample, moving reviews from Maya to Tomas and one coordination slice from Lena to Aisha clears both flags without a single hire. Most overallocation is a routing problem, and the grid makes the reroute visible enough to negotiate in one meeting.
Update it weekly, in the same meeting
A resource plan decays in about two weeks untouched. Walk the sheet at the top of the weekly team meeting, change the shares that moved and read out any row whose Load flag changed. Five minutes is enough. The plan stays believable because everyone watched it get corrected, which is what makes people trust the flags when one carries their name.
Percent, hours or FTE: pick one unit and hold it
Percent of week is the friendliest unit for a plan people maintain by hand, since 100 means one whole person and nobody converts anything in their head. Hours work better where the team already schedules against a number, which is why the second download plans against 32 project hours of a 40 hour week, the share left after meetings and email take their cut. FTE suits staffing conversations about roles rather than named people, and the third download runs on it.
What breaks plans is mixing units in one sheet. A grid where one row means percent and the next means hours produces totals that look precise and mean nothing. Pick the unit that matches how your team talks about time, then convert at the boundary: 25 percent of a 40 hour week is 10 hours, and 0.5 FTE on a role is 20. Our FTE calculator below does the conversion both directions if you want to check one.
Resource planning in project management: this sheet or the capacity plan
The two names get used interchangeably and the sheets are different tools. Resource planning is by person: which named people carry which projects, at what share, with flags on individual rows. Capacity planning is aggregate: does the team as a whole have enough hours for the demand coming at it next quarter. This page is the first sheet, the project management resource planning template of the pair. Our capacity planning template is the second, with demand versus capacity math rolled up by week.
In practice the aggregate sheet answers whether to take the work, and the per-person sheet answers who does it without breaking anyone. Teams that run only the aggregate view hit a specific failure: total capacity says yes while three named people are at 120 percent, because averages hide the people the work actually lands on. The sample data here shows that exact case, a team with headroom in total and two overallocated rows inside it.
Frequently asked questions
What should a resource planning template include?
Five things: a row per person, a column per project, a share of the week in each cell, computed Allocated and Available columns, and a flag that fires past a threshold. The download here adds a BAU column for non-project load and a team totals row that converts column sums into rough FTE, so 305 percent on one project reads as three people plus change.
What is the difference between resource planning and capacity planning?
Resource planning tracks named people and their share on each project, one row per person. Capacity planning compares total team hours against total demand, usually by week, without naming who does what. You need the aggregate view to decide whether to accept work and the per-person view to assign it. If you searched for a resource capacity planning template, our capacity planning template linked below is that aggregate half.
What allocation percentage counts as overallocated?
Anything past 100 percent of the week is overallocated by definition, and the template flags it at exactly that line. Many teams also treat 90 to 100 as Full, since a person at 100 has zero slack for the interrupt work that arrives every week. The Load formula in the download uses both thresholds and you can edit either number in one place.
How many projects can one person work on at a time?
Two significant projects is the practical ceiling for most roles, three if one is a light coordination role. Every switch between projects costs recovery time, commonly estimated at 20 percent of a week for heavy multitaskers. The sample data shows the failure mode: Maya carries slices of all three projects and lands at 120 percent without any single project looking greedy.
How much of a week should go to non-project work?
Plan on 10 to 30 percent depending on seniority and on-call duty. The sample team charges 10 percent for most engineers, 20 for the project manager and 30 for the DevOps engineer who owns production support. If you skip this column, every allocation in the sheet overstates real availability by that same amount.
Should I plan in percent, hours or FTE?
Percent of week for a plan humans update by hand, hours for teams that already schedule against a weekly number, FTE for staffing roles before people are named. The three downloads cover the three units: the hero grid plans in percent, the allocation sheet plans against 32 project hours, and the staffing plan works in FTE with a computed gap.
Is there an Excel version of the resource planning template?
All three downloads are .xlsx files that open in Excel with the ten-person sample team filled in, dropdowns included. The Allocated, Available and Load columns arrive as the computed sample values there, and the two formulas above rebuild in under a minute. In the live Wisegrid version the same columns stay live and recalculate as shares change.
How do I fix an overallocated person without hiring?
Scan the Available % column for headroom before doing anything else. In the sample, Aisha holds 30 free points and Tomas and Priya hold 15 each, which is more than enough to absorb the 25 combined points that Maya and Lena are over. Reassign work to the headroom, cut scope, or push a date. Hiring is the answer only when the whole team totals past its ceiling for months.
Run it live instead of in a file.
The downloads above are yours either way. In Wisegrid the same template becomes a working sheet with owner contacts, status dropdowns, reminders, and dashboards. 7-day free trial, no credit card required.